Did you know that over 300,000 patents were granted by the U.S. Patent and Trademark Office (USPTO) in 2013 alone? Of those patent applicants who were fortunate enough to get their patents granted, it might surprise you to learn that over 50% of them are based in countries other than the United States.In the infographic below, we took some of the high level statistics from the most recently available patent application and grant data from the USPTO website (http://www.uspto.gov/web/offices/ac/ido/oeip/taf/reports.htm). In addition to the country of origin for granted patents, we looked at stats like which states in the U.S. the most granted patents came from, which classes of patent represent the most patent grants, and which Universities have received the most patent grants during the years between 1969 and 2012.We hope you enjoy this infographic. If you’d like to re-publish it on your blog or website, simply scroll to the bottom of the page to find the HTML embed code that you are welcome to use.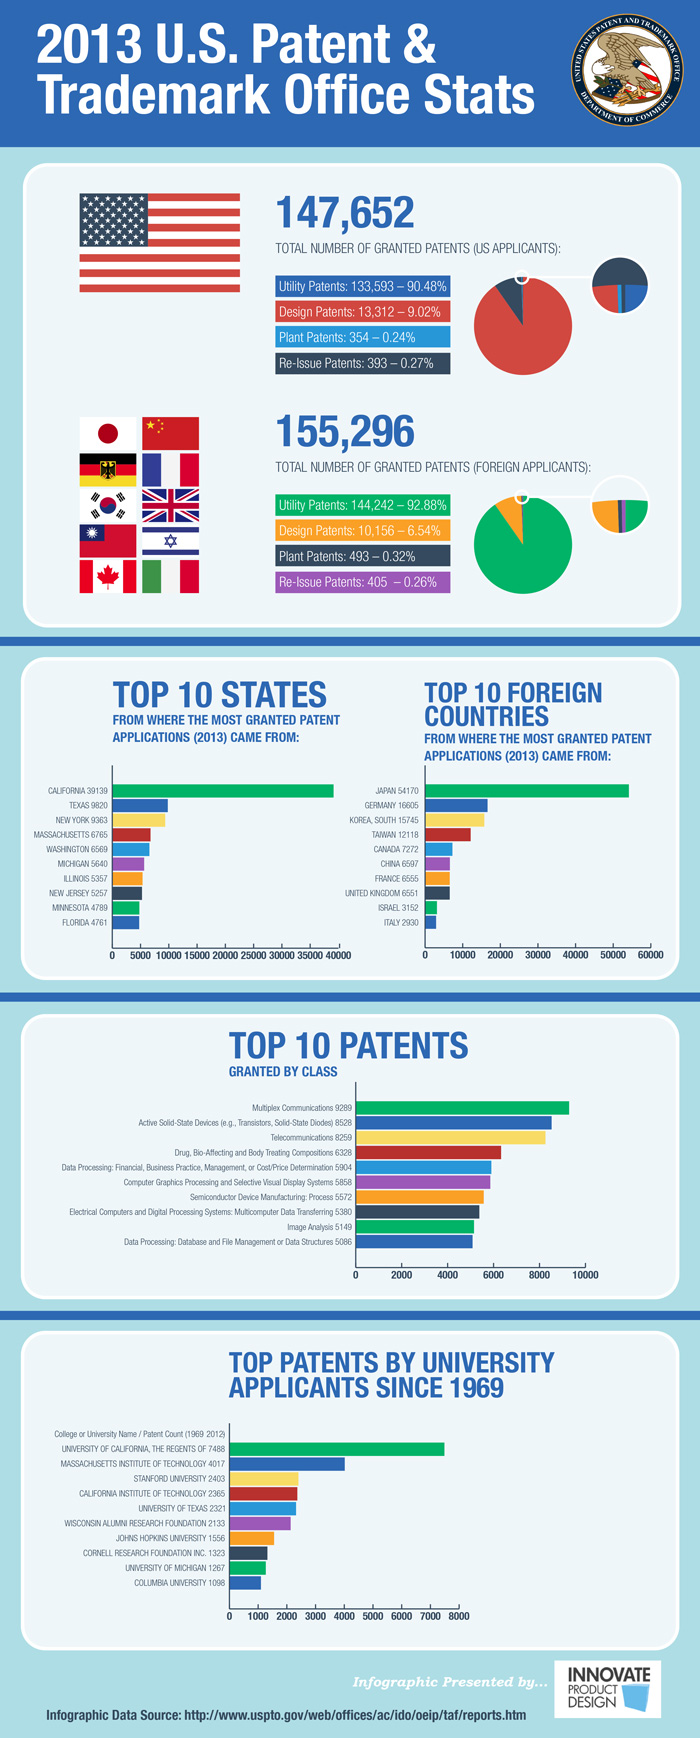
2013 U.S. Patent Stats from the USPTO